| Mandalika's scratchpad | [ Work blog @Oracle | My Music Compositions ] |
Old Posts: 09.04 10.04 11.04 12.04 01.05 02.05 03.05 04.05 05.05 06.05 07.05 08.05 09.05 10.05 11.05 12.05 01.06 02.06 03.06 04.06 05.06 06.06 07.06 08.06 09.06 10.06 11.06 12.06 01.07 02.07 03.07 04.07 05.07 06.07 08.07 09.07 10.07 11.07 12.07 01.08 02.08 03.08 04.08 05.08 06.08 07.08 08.08 09.08 10.08 11.08 12.08 01.09 02.09 03.09 04.09 05.09 06.09 07.09 08.09 09.09 10.09 11.09 12.09 01.10 02.10 03.10 04.10 05.10 06.10 07.10 08.10 09.10 10.10 11.10 12.10 01.11 02.11 03.11 04.11 05.11 07.11 08.11 09.11 10.11 11.11 12.11 01.12 02.12 03.12 04.12 05.12 06.12 07.12 08.12 09.12 10.12 11.12 12.12 01.13 02.13 03.13 04.13 05.13 06.13 07.13 08.13 09.13 10.13 11.13 12.13 01.14 02.14 03.14 04.14 05.14 06.14 07.14 09.14 10.14 11.14 12.14 01.15 02.15 03.15 04.15 06.15 09.15 12.15 01.16 03.16 04.16 05.16 06.16 07.16 08.16 09.16 12.16 01.17 02.17 03.17 04.17 06.17 07.17 08.17 09.17 10.17 12.17 01.18 02.18 03.18 04.18 05.18 06.18 07.18 08.18 09.18 11.18 12.18 01.19 02.19 05.19 06.19 08.19 10.19 11.19 05.20 10.20 11.20 12.20 09.21 11.21 12.22 02.26
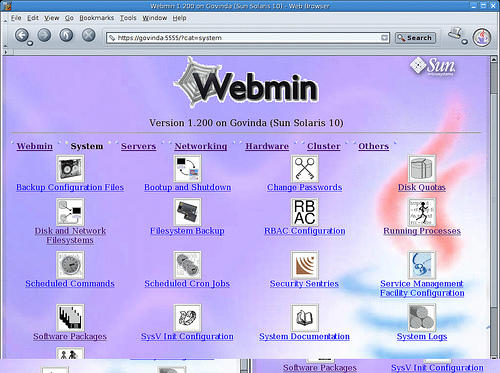
/usr/sbin/smc) is also available on Solaris 8 and later. However Webmin is faster and light weight compared to SMC.Instructions for the setup:
- Login as root
-
cd /usr/sfw/lib/webmin - Run the setup script
-
./setup.sh
- Enter 1 for Operating System ie., Sun Solaris. There's Sun Java Desktop System as option 59. Perhaps it is the Linux version of JDS
- Enter 6 for Version ie., Sun Solaris 10
- Enter a port number for the web server. 10000 is the default port
- Installation completes without asking any further questions
-
- Open up the URL: https://localhost:10000 in a web browser. Replace 10000 with the configured port, if the default value has been changed
- Login as root, and have fun
- To uninstall webmin, simply run
/etc/webmin/uninstall.sh
Here's a screenshot of Webmin running on Solaris 10/JDS:
Note:
- For other versions of Solaris, download webmin from prdownloads.sourceforge.net/webadmin/webmin-1.230.tar.gz web page, and follow the instructions posted here
- Webmin documentation is at www.webmin.com/index2.html
- According to the supported Operating Systems web page, The best supported systems at the moment are Solaris, Linux (Redhat in particular) and FreeBSD. Webmin currently supports 59 flavors of *nix {and even Windows, I guess}
Technorati tag: Solaris
While Volume Management Daemon (
vold) is running, Solaris rejects all CD/DVD media and ejects 'em as soon as they were inserted in the CD/DVD drive. However manual mounting of the same media works, with no issues.Solution:
vold needs the removable media device server smserver, to be running in order to manage the removable media devices. So, make sure smserver is enabled, and on-line.# svcs -l smserver
fmri svc:/network/rpc/smserver:default
name removable media management
enabled false
state disabled
next_state none
state_time Thu Sep 29 20:25:19 2005
restarter svc:/network/inetd:default
contract_id
dependency require_all/restart svc:/network/rpc/bind (online)
smserver is not running, and the following lines from truss output confirms that client (vold) is not able to communicate with the smserver./9: open("/var/run/smedia_svc", O_RDONLY) = 35
/9: door_call(35, 0xD244DCA0) Err#9 EBADF
/9: close(35) = 0The above series of calls can be easily mapped to the Solaris source code hosted at OpenSolaris web site, starting from call to
smedia_get_handle in medium.c, and then tracing the calls further {in source code}.Comments in smediad.c source file helps understanding the implementation a bit.
So to resolve this issue, simply bring
smserver online. Let's continue with the above example.# svcadm -v enable smserver
svc:/network/rpc/smserver:default enabled.
# svcs -p smserver
STATE STIME FMRI
online 21:17:43 svc:/network/rpc/smserver:default
Now
vold is able to communicate with smserver and did its job of mounting the removable media (CD).Excerpt from
truss output:/10: open("/var/run/smedia_svc", O_RDONLY) = 36
/10: door_call(36, 0xD244DDB8) = 0
/10: close(36) = 0Here's the
df output:# df -h | grep cdrom________________
/vol/dev/dsk/c1t0d0/wgr614v5 239M 239M 0K 100% /cdrom/wgr614v5
Technorati tag: Solaris | OpenSolaris
Sun Microsystems bundled a tool called
tcov (short for: test coverage), with Sun Studio compiler suite, for code coverage analysis. tcov gives line-by-line information on how a program executes. Most of this information is annotated in a copy of the source file {with .toc extension}, when the {tcov} tool is run against the source file, along with profile data from the execution of test cases.Steps to do the Code Coverage Analysis with
tcov- Compile the program with additional option
-xprofile=tcov - Run the program and all the test cases against the application. Since it was compiled with
-xprofileoption, {by default} the run-time will create a directory called<executable>.profilein the same directory from where the executable is run. This behavior can be overridden by settingSUN_PROFDATA_DIRorSUN_PROFDATAenvironment variables.<executable>.profiledirectory contains a file calledtcovd.tcovdholds the information about the line numbers, and the execution count. This is a plain text file. - Run
tcovwith -x option, over each source file to generate the annotated source file
eg.,
% cat tcovex.cNote:
#include <stdio.h>
#include <stdlib.h>
static unsigned _sum (unsigned *a0, unsigned *a1, unsigned *a2) {
unsigned result = 0;
if (a0 == NULL) {
printf("a0 == NULL");
} else {
result += (*a0);
}
if (a1 == NULL) {
printf("a1 == NULL");
} else {
result += (*a1);
}
if (a2 == NULL) {
printf("a2 == NULL");
} else {
result += (*a2);
}
return (result);
}
int main(int argc, const char *argv[]) {
int i, j, niters = 1, n=3;
unsigned sum, answer = 0, a[3];
niters = 1000000000;
if (argc == 2) {
niters = atoi(argv[1]);
}
for (j = 0; j < n; j++) {
a[j] = rand();
answer += a[j];
}
for (i = 0; i < niters; i++) {
sum = _sum (a+0, a+1, a+2);
}
if (sum == answer) {
printf("answer = %u\n", answer);
} else {
printf("error sum=%u, answer=%u", sum, answer);
}
return (0);
}
% cc -xO2 -xprofile=tcov -o tcovex tcovex.c
% setenv SUN_PROFDATA_DIR /tmp
% ls -ld /tmp/*.profile
No match
% ./tcovex 10000000
answer = 32709
% ls -ld /tmp/*.profile
drwxrwxrwx 2 build engr 179 Sep 22 19:25 /tmp/tcovex.profile/
% ls -lR /tmp/tcovex.profile/
/tmp/tcovex.profile/:
total 16
-rw-rw-rw- 1 build engr 318 Sep 22 19:25 tcovd
% tcov -x $SUN_PROFDATA_DIR/tcovex.profile tcovex.c
% ls -l $SUN_PROFDATA_DIR/*.tcov
-rw-rw-rw- 1 build engr 1857 Sep 22 19:27 /tmp/tcovex.c.tcov
% cat /tmp/tcovex.c.tcov
#include
#include
static unsigned _sum (unsigned *a0, unsigned *a1, unsigned *a2) {
10000000 -> unsigned result = 0;
if (a0 == NULL) {
##### -> printf("a0 == NULL");
} else {
10000000 -> result += (*a0);
}
10000000 -> if (a1 == NULL) {
##### -> printf("a1 == NULL");
} else {
10000000 -> result += (*a1);
}
10000000 -> if (a2 == NULL) {
##### -> printf("a2 == NULL");
} else {
10000000 -> result += (*a2);
}
return (result);
}
int main(int argc, const char *argv[]) {
1 -> int i, j, niters = 1, n=3;
unsigned sum, answer = 0, a[3];
niters = 1000000000;
if (argc == 2) {
1 -> niters = atoi(argv[1]);
}
1 -> for (j = 0; j < n; j++) {
3 -> a[j] = rand();
answer += a[j];
}
1 -> for (i = 0; i < niters; i++) {
10000000 -> sum = _sum (a+0, a+1, a+2);
}
1 -> if (sum == answer) {
1 -> printf("answer = %u\n", answer);
} else {
##### -> printf("error sum=%u, answer=%u", sum, answer);
}
return (0);
}
Top 10 Blocks
Line Count
6 10000000
11 10000000
14 10000000
17 10000000
20 10000000
23 10000000
45 10000000
40 3
30 1
36 1
18 Basic blocks in this file
14 Basic blocks executed
77.78 Percent of the file executed
70000009 Total basic block executions
3888889.25 Average executions per basic block
Lines with prefix "#####" were never executed.
Reference and suggested reading:
Sun Studio 10 man page of
tcov__________________
Technorati tags: sun studio
C
C++
HOW TOs
Solaris- Fixing sound card woes
- Solaris 10: USB Digital Camera HOWTO
- Mounting a CD-ROM manually
- Hijacking a function call (interposing)
- Installing apps/packages with pkg-get
- Recovering from a Runtime Linker Failure I | II | III
- An Odyssey to Solaris 11 on Solaris Express 17
- Writing a Signal Handler
- lofiadm - Mounting an ISO image on Solaris file system
- Getting rid of [English/European] bar underneath every window
- Setting up a DHCP client
- Resetting Forgotten Root Password
- Build a Shared Library
- Building ICU 2.2 & Xerces 2.1 on Solaris 10 x86
- Building MPlayer
- Splitting and Merging Files
- Installing Sun Java Desktop System 2.0
- Find the amount of free & used memory
- Installing Dynamic Fonts
- Installing Source RPM (SRPM)
- Recovering from Frozen XWindows
- JDS Linux & Sony DSC-V1/W1 Digital Camera
About
Solaris- MPSS: More performance with Large Pages (Solaris 9 and higher)
- malloc vs mtmalloc
- Solaris Virtual Memory System
- File permissions
- UNIX terminology
- Year 2038 rollover problem
- Know the process resource limits
- CPU hog with connections in CLOSE_WAIT
- 32-bits , fopen() and max number of open files
- Running Enterprise applications on Solaris 10
- Binary Compatibility
- Undocumented Thread Environment Variables
- Linker: -B {static | dynamic}
- Initialization & Termination routines in a dynamic object
- Printing Stack Trace with printstack()
- OpenSolaris: Open for download
- Some useful commands
- Some tips
- Linker Scoping default scope | default scope contd. | symbolic scope | symbolic scope contd. | hidden scope | adv/disadv of global scope | Benefits of Linker Scoping
- Consolidated content is available as an article: Reducing symbol scope with Sun Studio C/C++
- Profile Feedback Optimization (PFO or FBO) I | II
- Investigating memory leaks with Collector/Analyzer
- global const variables, symbol collisions & symbolic scoping
- Behavior of Sun C++ Compiler While Compiling Templates
- Annotated listing (compiler commentary) with er_src
- Support for UTF-16 String Literals
- Sun Studio 9: RR or GA?
- Position Independent Code (PIC)
- Inlining routines
- #pragma pack
- cscope - an interactive program examiner
- Life Cycle of a C/C++ program
- C/C++/Java: ++ unary operator
- struct vs union
- Functions with variable numbers of arguments
- Virtual functions
- C/C++ & Object Oriented Jargon
- C++ name mangling
- External Linkage
- Also available as an article: Mixed Programming & External Linkage
- 2s complement
- Conditional compilation and #if 0
- Assertions
- Oracle Server architecture
- Sun achieves winning Siebel benchmark
- Activating Comcast High Speed Internet Account
- Csh: Arguments too long error
- MPlayer: Extracting Audio from a DVD
Technorati tag: Solaris | Sun Studio | C | C++
Compiling with multiple profiles
Even though it was not mentioned explicitly {in plain english} in the C++ compiler options, Sun C/C++ compilers accept multiple profiles on the compile line, with multiple
-xprofile=use:<dir> options. -xprofile=use:<dir>:<dir>..<dir> results in a compilation error.eg.,
CC -xO4 -xprofile=use:/tmp/prof1.profile -xprofile=/tmp/prof2.profile driver.cppWhen compiler encounters multiple profiles on the compile line, it merges all the data before proceeding to do optimizations based on the feedback data.
Building patches contd.,
In general, it is always recommended to collect profile data, whenever something gets changed in the source code. However it may not be feasible to do it, when very large applications were built with feedback optimization. So, organizations tend to skip the feedback data collection when the changes are limited to very few lines (Quick fixes); and to collect the data once the quick fixes become large enough to release a patch Cluster (aka Fix pack). Normally fix packs will have the binaries for the entire product, and all the old binaries will be replaced with the new ones when the patch was applied.
It is important to know, how a simple change in source code affects the feedback optimization, in the presence of old profile data. Assume that an application was linked with a library
libstrimpl.so, that has implementation for string comparison (__strcmp) and for calculating the length of a string (__strlen).eg.,
% cat strimpl.h
int __strcmp(const char *, const char *);
int __strlen(const char *);

% cat strimpl.c
#include <stdlib.h>
#include "strimpl.h"

int __strcmp(const char *str1, const char *str2 ) {
   int rc = 0;

   for(;;) {
      rc = *str1 - *str2;
      if(rc != 0 || *str1 == 0) {
         return (rc);
      }
      ++str1;
      ++str2;
   }
}

int __strlen(const char *str) {
        int length = 0;

        for(;;) {
                if (*str == 0) {
                        return (length);
                } else {
                        ++length;
                        ++str;
                }
        }
}

% cat driver.c
#include <stdio.h>
#include "strimpl.h"

int main() {
        int i;

        for (i = 0; i < 50; ++i) {
                printf("\nstrcmp(pod, podcast) = %d", __strcmp("pod", "podcast"));
                printf("\nstrlen(Solaris10) = %d", __strlen("Solaris10"));
        }

        return (0);
}
Now let's assume that the driver was built with the feedback data, with the following commands:
cc -xO2 -xprofile=collect -G -o libstrimpl.so strimpl.c
cc -xO2 -xprofile=collect -lstrimpl -o driver driver.c
./driver
cc -xO2 -xprofile=use:driver -G -o libstrimpl.so strimpl.c
cc -xO2 -xprofile=use:driver -lstrimpl -o driver driver.c
For the next release of the driver, let's say the string library was extended by a routine to reverse the given string (
__strreverse). Let's see what happens if we skip the profile data collection for this library, after integrating the code for __strreverse routine. The new code can be added anywhere (top, middle or at the end) in the source file.Case 1: Assuming the routine was added at the bottom of the existing routines
% cat strimpl.c
#include <stdlib.h>
#include "strimpl.h"

int __strcmp(const char *str1, const char *str2 ) { ... }

int __strlen(const char *str) { ... }

char *__strreverse(const char *str) {
        int i, length = 0;
        char *revstr = NULL;

        length = __strlen(str);
        revstr = (char *) malloc (sizeof (char) * length);

        for (i = length; i > 0; --i) {
                *(revstr + i - 1) = *(str + length - i);
        }

        return (revstr);
}

% cc -xO2 -xprofile=use:driver -G -o libstrimpl.so strimpl.c
warning: Profile feedback data for function __strreverse is inconsistent. Ignored.
This (adding the new code at the bottom of the source file) is the recommended/wisest thing to do, if we don't want to collect the feedback data for the new code that we add. Doing so, the existing profile data remains consistent, and get optimized as before. Since there is no feedback data available for the new code, compiler simply does the optimizations as it usually does without
-xprofile.Case 2: Assuming the routine was added somewhere in the middle of the source file
% cat strimpl.c
#include <stdlib.h>
#include "strimpl.h"

int __strcmp(const char *str1, const char *str2 ) { ... }

char *__strreverse(const char *str) {
        int i, length = 0;
        char *revstr = NULL;

        length = __strlen(str);
        revstr = (char *) malloc (sizeof (char) * length);

        for (i = length; i > 0; --i) {
                *(revstr + i - 1) = *(str + length - i);
        }

        return (revstr);
}

int __strlen(const char *str) { ... }

% cc -xO2 -xprofile=use:driver -G -o libstrimpl.so strimpl.c
warning: Profile feedback data for function __strreverse is inconsistent. Ignored.
warning: Profile feedback data for function __strlen is inconsistent. Ignored.
As compiler keeps track of the routines by line numbers, introducing some code in a routine makes its profile data inconsistent. Also since the position of all other routines that are underneath the newly introduced code may change, their feedback data becomes inconsistent, and hence compiler ignores the profile data, to avoid introducing functional errors.
The same argument holds true, when the new code was added at the top of the existing routines; but it makes it even worse, since all the profile data for the routines of this object become unusable (inconsistent). Have a look at the warnings from the following example:
Case 3: Assuming the routine was added at the top of the source file
#include <stdlib.h>
#include "strimpl.h"

char *__strreverse(const char *str) {
        int i, length = 0;
        char *revstr = NULL;

        length = __strlen(str);
        revstr = (char *) malloc (sizeof (char) * length);


        for (i = length; i > 0; --i) {
                *(revstr + i - 1) = *(str + length - i);
        }

        return (revstr);
}

int __strcmp(const char *str1, const char *str2 ) { ... }

int __strlen(const char *str) { ... }

% cc -xO2 -xprofile=use:driver -G -o libstrimpl.so strimpl.c
warning: Profile feedback data for function __strreverse is inconsistent. Ignored.
warning: Profile feedback data for function __strcmp is inconsistent. Ignored.
warning: Profile feedback data for function __strlen is inconsistent. Ignored.
SPARC, x86/x64 compatibility
At this time, there is no compatibility between the way the profile data gets generated & gets processed on SPARC, and x86/x64 platforms. That is, it is not possible to share the feedback data generated by C/C++ compilers on SPARC, in x86/x64 platforms and vice-versa.
However there seems to be some plan in place to make it compatible in Sun Studio 12 release.
Asynchronous profile collection
Current profile data collection requires the process to be terminated, in order to dump the feedback data. Also with multi-threading processes, there will be some incomplete profile data generation, due to the lock contention between multiple threads. If the process dynamically loads, and unloads other libraries with the help of
dlopen(), dlclose() system calls, it leads to indirect call profiling, and it has its share of problems in collecting the data.Asynchronous profile collection eases all the problems mentioned above by letting the profiler thread to write the profile data it is collecting, periodically. With the asynchronous data collection, the probability of getting the proper feedback data is high.
This feature will be available by default in Sun Studio 11; and as a patch to Sun Studio 9 & 10 compilers. Stay tuned for the exact patch numbers for Studio 9 and 10.
Notes:
- When
-xprofile=collectis used to compile a program for profile collection and-xprofile=useis used to compile a program with profile feedback, the source files and compiler options other than-xprofile=collectand-xprofile=usemust be identical in both compilations - If both
-xprofile=collectand-xprofile=useare specified in the same command line, the rightmost-xprofileoption in the command line is applied - If the code was compiled with
-gor-g0options, with the help ofer_srcutility, we can see how the compiler is optimizing with the feedback data. Here's how to: Sun Studio C/C++: Annotated listing (compiler commentary) wither_src
Chris Aoki, Sun Microsystems
__________________
Technorati tags: Sun Studio | C | C++
| 2004-2026 |
|